Thursday, 17 May 2012

The acid test for antibody function?


Check out the marker M (Cohn fraction IgG)


Acetate buffer, pH 5.5                                Acetate buffer, pH 5.05
CIM-DEAE                                                                   CIM-EDA
Again, check out marker M.  Why does it look different on the right side? 
Where is the BSA in CIM-EDA on the right? Did they let the gel run out? Or cut the gel off at BSA level? 
So would there be as many bands under IgG in the other gels also if they let the bands resolve better? 
Probably cleanest bands in lanes 1 and 2 for IgG in CIM-DEAE disk with acetate buffer, pH 5.5 (above).  Would the acidic pH affect the antibody's structure/function?  Can this condition be used for monoclonal IgG or IgG from sera after using the technique in J. Chrom B (2010) (Ref: post "Mixed opinions, disturbed flow) to clean up the antibodies?   Is it cost-effective?


25 mM MOPS buffer, pH 6.5                               
                          CIM-DEAE                                                               
Again, check out marker M - still Cohn fraction IgG or mixture of pure IgG and BSA?


20 mM Tris buffer, pH 7.4                                20 mM Tris buffer, pH 8.0
CIM-DEAE                                                                   CIM-EDA
Again, check out marker M.  It wasn't included in the gel for CIM-DEAE so it was cut and pasted from Fig. 2a (the acetate buffer elution gel for the same disk).
M looks even more different in the gel on the right side!
Gel image quality!!!
There's still liquid between the gel and the scanner glass in the left side image!!!

Dhivya, A., Kumar, B., Prasanna, R., Jayaprakash, N., & Vijayalakshmi, M. (2010). Purification of Monoclonal Antibodies from Cell-Culture Supernatant by Use of Anion-Exchange Convective Interaction Media (CIM) Monolithic Columns Chromatographia, 72 (11-12), 1183-1188 DOI:


Dhivya, A.P., Kumar, B.P., Prasanna, R.R., Jayaprakash, N.S. & Vijayalakshmi, M.A. (2010). Purification of Monoclonal Antibodies from Cell-Culture Supernatant by Use of Anion-Exchange Convective Interaction Media (CIM) Monolithic Columns, Chromatographia, 72 (11-12) 1188. DOI: 10.1365/s10337-010-1787-3

Autoimmune hydrolytic antibodies


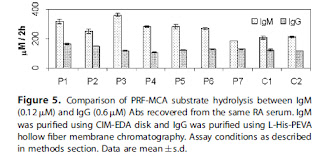
Concentration of positive control, trypsin?  20 patients, 5 healthy donors for IgM studies; 45 patients and (how many?) healthy donors for IgG studies.  Enough sample size?


      The IgM here is supposed to contain just two bands for the heavy and light chains shown in lane c of Fig. 2B (reduced conditions) but again, there are some more bands in that lane. But in Fig. 2A (non-reducing conditions), lanes a, b and c show several bands. The authors state that peak 4 had homogeneous IgM, yet the lane corresponding to peak 4 (lane c of Fig. 2A) also shows (at least) two bands besides the two at the top. What could be the explanation for this?

IgG here looks like it's always got lower proteolytic activity than IgM even though roughly 5 fold more IgG was used. Was this the same IgG purified for the 2009 paper?  How about purifying IgG using any of the conditions used for purification of IgG antibodies with CIM disks so that fresh IgG could be compared to IgM here?
How significant would the differences in proteolytic activity be for IgG and IgM from sera of healthy donors and patients?
These two figures are from the 2009 JMR paper (title given below). Proteolysis, DNA and RNA hydrolysis were compared for the IgG.  Why were all three not tested for IgM (especially considering the RNAse activity for IgG)?


 Image quality!!!


Kamalanathan AS, Goulvestre C, Weill B, & Vijayalakshmi MA (2010). Proteolysis activity of IgM antibodies from rheumatoid arthritis patients' sera: evidence of atypical catalytic site. Journal of molecular recognition : JMR, 23 (6), 577-82 PMID:
Kamalanathan, A.S. & Vijayalakshmi, M.A. (2009). Molecular studies of rheumatoid factor using pseudobioaffinity membrane chromatography, Journal of Molecular Recognition, 22 (2) 153. DOI: 10.1002/jmr.921

Wednesday, 16 May 2012

Mixed opinions, disturbed flow


Loading of unequal amounts of protein at different temperatures and different buffer conditions (Tables 1 and 2). 
How to compare 20 mg loaded at 4C in 50 mM PBS (pH 7.4) to 125 mg loaded at 37C in 50 mM PBS (pH 7.4) to determine temperature effects on binding, elution etc?


 But besides the salt in the buffer, there's also more protein loaded at 24 C and 37 C than at 4 C (Tables 1 and 2 above). Wouldn't that also result in more sorbent binding and hence, eluting?


Figures 5, 6, 9, 10 and the paragraph above: decreasing the pH to 4 elutes the protein from both ligands.  Lower pH = higher concentrations of hydrogen ions which can protonate ligands AND the proteins in the mixture.
Maybe increasing protonation of IgG and other proteins decreases their negative charge and the protonation of ligands would decrease electrostatic interactions between basic nitrogen of the ligand and negatively charged groups of acidic amino acid residues of IgG (and other proteins). 
This means that pH 4 can elute these proteins better than higher pH.
But the lanes in the gels containing pH 5.5 eluates also contain IgG, much like the lanes in the gels containing pH 4 eluates. So why does "pH 5.5 not favour adsorption of IgG"?


 Increasing salt concentration has been used to elute many proteins from (especially) hydrophobic supports.   It disrupts electrostatic interactions between the ligand (support) and the proteins and helps their elution.  So how can it be said that "at higher concentration of salt (0.6 M and 0.8 M NaCl) no protein elutes instead it binds more strong to the column due to hydrophobic interaction (not shown in gel)"? 
It may well be that whatever binds predominantly through electrostatic interactions is eluted with increasing concentrations of salt (and increasing this beyond a certain threshold doesn't help) and beyond this, whatever's stuck on the ligand/support is mostly (or more) through hydrophobic interactions so only very harsh conditions can elute this. 
It may also be that salt molecules attract water molecules towards themselves and create a "hydrophobic" environment in the vicinity of the ligand-protein pairs. 
But does it mean that high concentrations of salt necessarily create that much hydrophobicity to make the proteins stick to the column more?  It would be interesting to see this data. 


 Given that loaded amounts are different for the two buffers and the two ligands at different temperatures, how accurate are these statements about binding capacity?


Ranjini, S.S., Bimal, D., Dhivya, A.P. & Vijayalakshmi, M.A. (2010). Study of the mechanism of interaction of antibody (IgG) on two mixed mode sorbents, Journal of Chromatography B, 878 (15-16) 1037. DOI:

Thursday, 10 May 2012

Seeing the error in science

Whom would you blame more for these oversights?  The authors?  The journal editors?  The peer reviewers? 


i)                    If values are expressed as means of n =3 plus/minus SD, where are the error bars in any of the graphs? 

 Why encapsulate if extracts themselves have higher polyphenol content than the capsules (Figure 2)?

Are EC50 values in Figure 3 ascorbic acid equivalents?  So higher ascorbic acid equivalents = higher EC50?  But EC50 definition is that lower the concentration to observe certain efficacy, the more potent is that substance.  So how do we interpret Figure 3? 


B. Chandrasekhar Reddy,, Ayesha Noor,, N.C. Sarada,, & M.A. Vijayalakshmi (2011). Antioxidant properties of Cordyline terminalis (L.) Kunth and Myristica fragrans Houtt. encapsulated separately into casein beads Current Science , 101 (3), 416-420